Introduction
The new SNB wireless test process produces results that are noticeably different from our previous process. So I’ll be retesting some of the more popular routers with the new process to provide a more accurate wireless performance comparison to routers reviewed going forward. First up is a retest of ASUS’ draft 802.11ac router, the RT-AC66U, last reviewed in August 2012.
To recap, our new process uses ASUS’ PCE-AC66 AC1750 PCIe adapter to test all wireless routers and APs. Routers are tested in 20 MHz mode only in the 2.4 GHz band and either 40 MHz mode for 802.11n products or 80 MHz mode for draft 802.11ac products in the 5 GHz band.
The RT-AC66U was upgraded to 3.0.0.4.354 firmware for the retest. The router was reset to factory defaults and Channel 6 was set for 2.4 GHz and Channel 153 for 5 GHz. The test client was connected using WPA2/AES encryption.
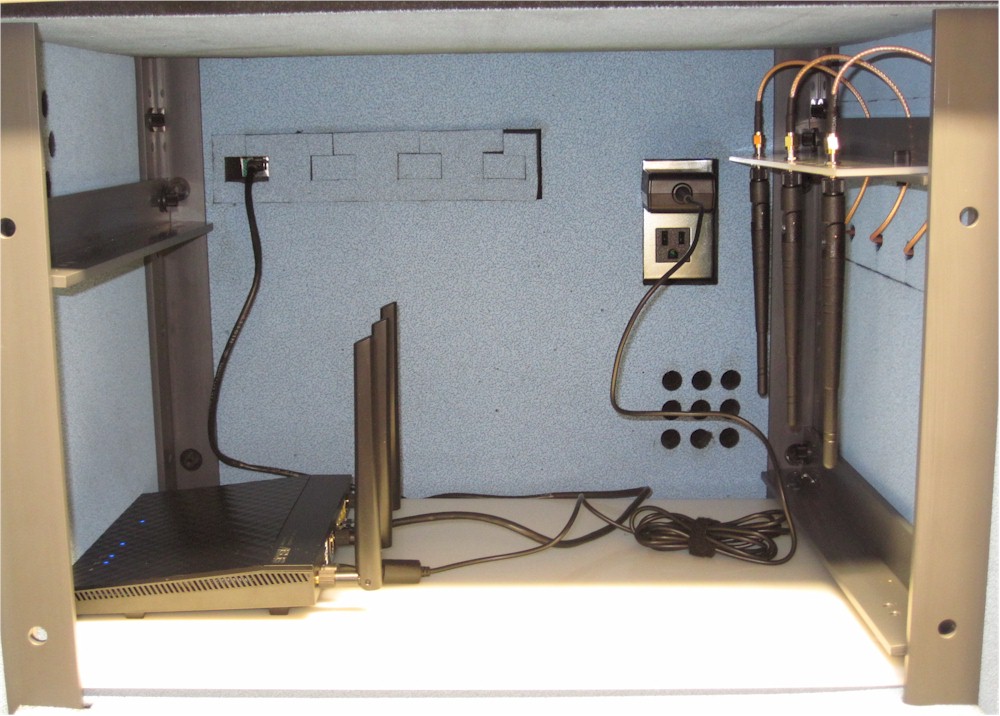
Here’s what the router looked like in the test chamber in its "0 degree" position. The router antennas were positioned 8" from the chamber antennas.

ASUS RT-AC66U in Upper Test Chamber – “0 degree” Position
The retest Benchmark Summary below is much simpler, due to the new Consolidated benchmark process. Remember that the summary shows the average of throughput measurements made in all test locations.

ASUS RT-AC66U Retest Benchmark Summary
The new process lets us see how throughput varies over a wide range of signal levels. Here’s what the plot looks like for 2.4 GHz, downlink (router to client AKA STA). The four values entered into the Charts database that correspond to Locations A, C, D and F are highlighted.

ASUS RT-AC66U 2.4 GHz Downlink Throughput vs. Attenuation
Remember the test suite is run four times, with the router turned 90 degrees between each run. The best throughput was measured with the router in the "0 degree" position, with the router antennas closest to the test chamber antennas. All retest values including the maximum 118 Mbps "Location A" value are higher than the results produced by the old method, which yielded best case downlink throughput of 90 Mbps in Location C.
The 2.4 GHz uplink plot is next. The values are very similar to downlink, unlike the previous method, which seemed to favor uplink. Best case uplink throughput was 119 Mbps.

ASUS RT-AC66U 2.4 GHz Uplink Throughput vs. Attenuation
The new test process still has a simultaneous uplink/downlink test in the strongest signal "Location A" (or with 0 dB attenuation). That value is part of the Benchmark Summary above and came in at 165 Mbps total throughput.
The 5 GHz downlink test summary reflects the router set to 80 MHz bandwidth mode, i.e. draft 802.11ac performance. Best case throughput of 318 Mbps was recorded at the "Location C" equivalent attenuation.

ASUS RT-AC66U 5 GHz Downlink Throughput vs. Attenuation
The 5 GHz uplink plot shows slightly lower peak throughput of 298 Mbps.

ASUS RT-AC66U 5 GHz Uplink Throughput vs. Attenuation
I didn’t rerun the Maximum AC throughput test and probably won’t on a regular basis for future reviews. But I will continue to run the simultaneous up/downlink test, which measured 484 Mbps for a single up/downlink pair.
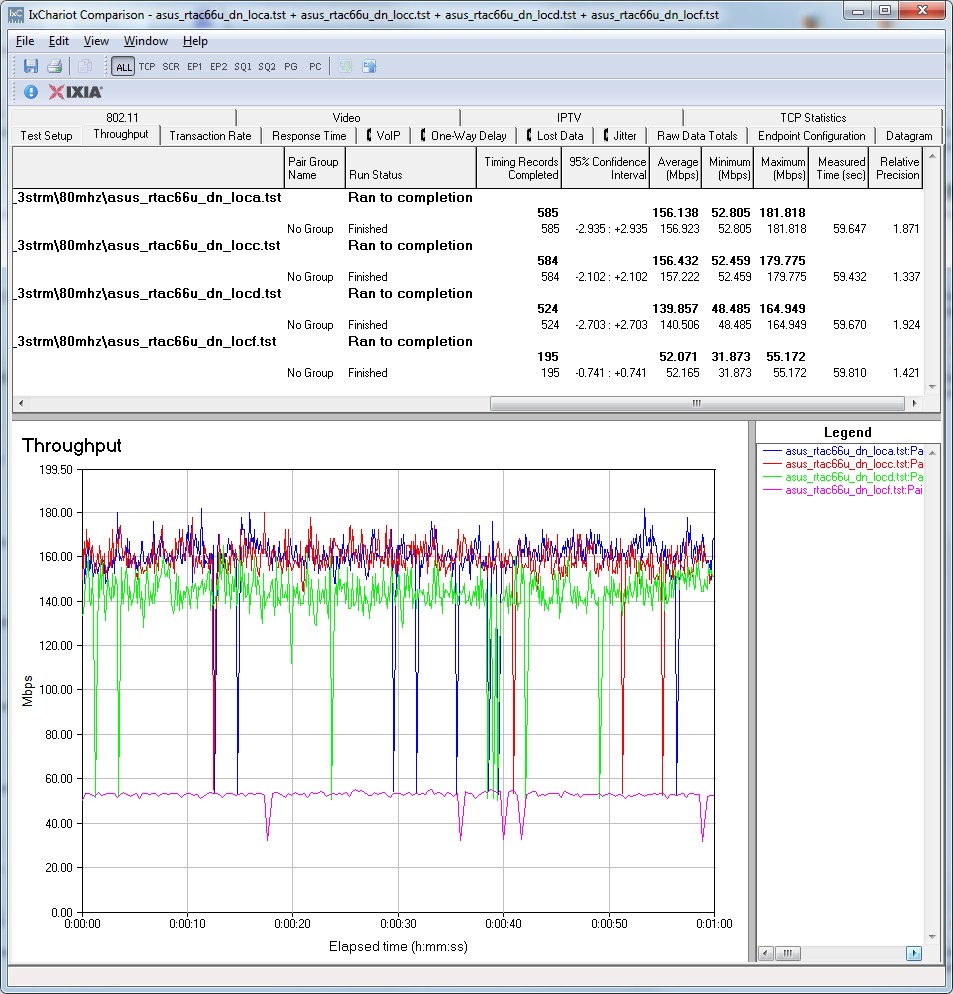
The new process seems to produce less variation in the IxChariot plots, too. Here’s the 5 GHz, 80 MHz mode downlink plot for the previous open-air test.

ASUS RT-AC66U 5 GHz Downlink IxChariot plot – Old Test Process
And here it is for the new test process. Part of the smoother look is due to the larger test file size (5,000,000 Bytes vs. 2,000,000).

ASUS RT-AC66U 5 GHz Downlink IxChariot plot – New Test Process
One thing that the new process shows more clearly is a 10+ second period before a draft 802.11ac stream kicks up to its maximum throughput. I’ve seen this in multiple products and multiple test runs and also with the old test process. So I suspect it is baked into Broadcom’s technology. I’ll keep an eye out for this in future testing.
Closing Thoughts
In general, the new test process provides a better environment for letting products show their best performance. The combination of ASUS PCIe adapter in a small format desktop computer provides for less stray RF coupling into the wireless adapter. You may remember from this article, that the Lenovo x220i used as one of the previous standard test clients had higher coupled noise than other laptops. This helps produce higher throughput results.
The other factor leading to higher performance readings is the octoBox MPE. This emulator provides higher decorrelation for the MIMO signals used in 802.11n and 11ac and higher decorrelation means higher throughput.
While this retest shows overall higher wireless throughput performance than the previous one, the difference is mostly in the test process change vs. tweaks that ASUS or Broadcom have made. That’s why I’ll be busy retesting a lot of routers, so that the new Router Ranker doesn’t give undue advantage to products tested with the new process.
