Introduction
I chose the Linksys EA6500 as our second router to retest with the new SNB wireless test process because I wanted to compare it to the EA6300, which will be reviewed shortly. We last reviewed the EA6500 in October 2012.
The EA6500 was upgraded to Ver.1.1.28.147876 firmware for the retest. The router was reset to factory defaults and Channel 6 was set and 20 MHz for 2.4 GHz and Channel 153 for 5 GHz. 20 MHz bandwidth mode was set for 2.4 GHz and 80 MHz mode (to enable draft 802.11ac link rates) was set for 5 GHz. The test client was connected using WPA2/AES encryption.
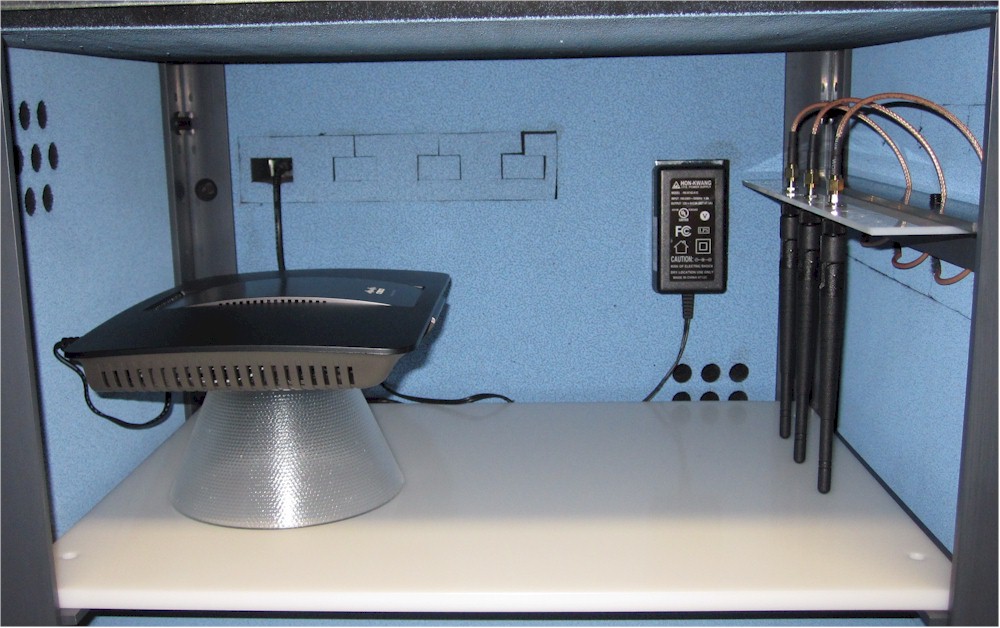
Here’s what the router looked like in the test chamber in its "0 degree" position. The router antennas (at the front of the router) were positioned 8" from the chamber antennas.

Linksys EA6500 in Test Chamber – "0 degree" Position
The retest Benchmark Summary below from the new Consolidated benchmark process shows the average of throughput measurements made in all test locations.

Linksys EA6500 Retest Benchmark Summary
The 2.4 GHz values in the summary above correspond to the 2.4 GHz values (20 MHz B/W) and the 5 GHz values above correspond to the 80 MHz B/W – 3 stream values in the previous review. Compared to the results in the last review’s benchmark summary, most of the retest values have gone up. The exception is 5 GHz uplink, which has gone down. We’ll see why in a bit.
The new process lets us see how throughput varies over a wide range of signal levels. Here’s what the plot looks like for 2.4 GHz, downlink (router to client AKA STA). The four values entered into the Charts database that correspond to Locations A, C, D and F are highlighted.

Linksys EA6500 2.4 GHz Downlink Throughput vs. Attenuation
I’ve been tweaking the new test method a bit and have switched from 5 dB to 3 dB steps and dispensed with the 1 dB steps at lower levels. Each plot step now represents half the power of the previous one. Note that in this case, I’m using the average of the four test runs, since they all cluster tightly vs. picking a "best" one. Note the dip in the throughput from 0 – 18 dB attenuation. I’ll offer a possible explanation for this shortly. Best case (0 dB) throughput in downlink was 114 Mbps.
The 2.4 GHz uplink plot is next. No dip in this direction. Best case throughput in this direction was the same as downlink—114 Mbps.

Linksys EA6500 2.4 GHz Uplink Throughput vs. Attenuation
The new test process still has a simultaneous uplink/downlink test in the strongest signal "Location A" (or with 0 dB attenuation). That value is part of the Benchmark Summary above and came in at 160 Mbps total throughput.
The 5 GHz downlink test summary reflects the router set to 80 MHz bandwidth mode, i.e. draft 802.11ac performance. 0 dB ("Location A) throughput averaged 313 Mbps over the four runs. This is significantly up from the 146 Mbps originally measured.

Linksys EA6500 5 GHz Downlink Throughput vs. Attenuation
The 5 GHz uplink plot shows lower peak throughput of 209 Mbps. This is 173 Mbps lower than the original measurement.

Linksys EA6500 5 GHz Uplink Throughput vs. Attenuation
The simultaneous up/downlink test measured 491 Mbps for a single 5 GHz up/downlink pair.
So why the lower 5 GHz uplink throughput? The composite uplink plot from the original review shows high variation in the Location A run plus an odd upward trend. Both these factors contribute to the higher 382 Mbps average throughput.

Linksys EA6500 original test 5 GHz uplink IxChariot plot
In contrast, the composite up/downlink 5 GHz 0 dB attenuation plot below shows uplink trying to switch gears from a starting 180 Mbps baseline to a higher throughput level around 9 seconds into the run, but falling back to only a slightly higher level around 200 Mbps. Downlink’s baseline throughput is higher than uplink and also tries to move up to > 450 Mbps levels, but also fails to stay there.

Linksys EA6500 5 GHz 0 dB up/downlink IxChariot plot – New Test Process
Finally, why the 2.4 GHz downlink dip? Here’s the IxChariot plot for 9 dB attenuation, the lowest point of the "dip". Downlink throughput is relatively steady, but below uplink, which has lots of spikes up to higher throughput levels.

Linksys EA6500 2.4 GHz 24 dB attenuation up/downlink IxChariot plot
And here is 24 dB, back at the peak. The plot colors have swapped, but now downlink is above uplink and shifts up to higher throughput levels about 18 seconds in and tends to stay there.

Linksys EA6500 2.4 GHz 24 dB attenuation up/downlink IxChariot plot
Why this is happening I don’t know. Perhaps due to receiver overload at the higher signal levels (lower attenutation values).
Closing Thoughts
We’re still in the early days of the new test process, but the trend in this and the ASUS RT-AC66U retest is generally toward higher throughput results. Now that that both the RT-AC66U and EA6500 have been retested, the Router Ranker accurately has the ASUS in the top spot among AC1750 class routers above the EA6500. I’ll be retesting the NETGEAR R6300 soon, to see if it still earns the #2 rank.
